
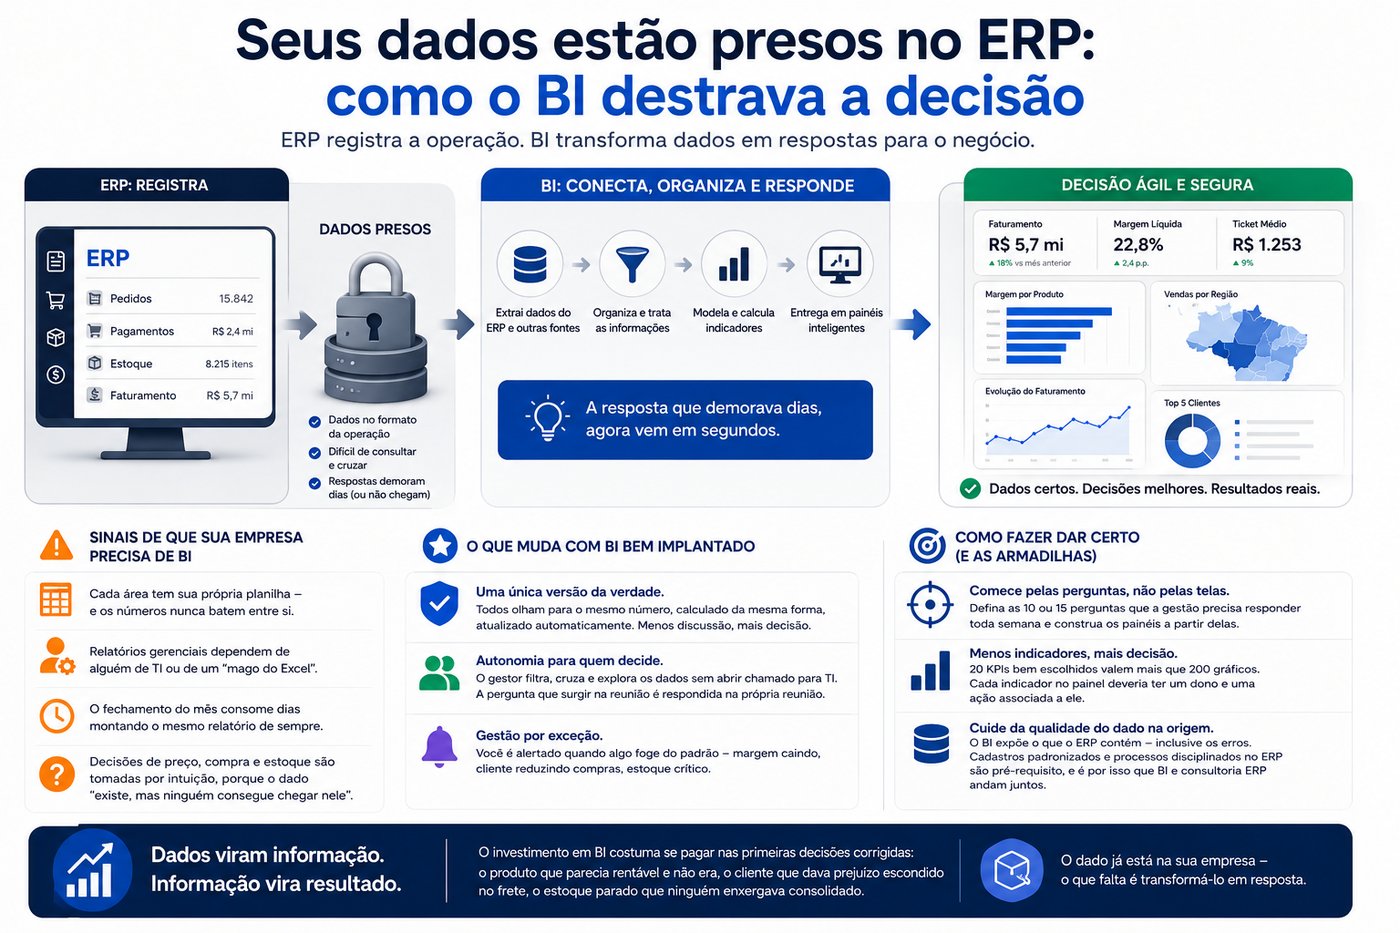
The ERP records. BI answers.
An ERP is a system of record: it was built to make sure the operation happens — billing, paying, controlling stock. But it stores data in the format of the operation, not the format of the decision. Business Intelligence bridges that gap: it extracts data from the ERP (and other sources), organizes it, and delivers it in dashboards that answer business questions in seconds, not days.
Signs your company needs BI
- Every department has its own spreadsheet — and the numbers never match up.
- Management reports depend on someone from IT or an "Excel wizard".
- Month-end close takes days building the same report as always.
- Pricing, purchasing, and stock decisions are made by intuition, because the data "exists, but nobody can get to it".
What changes with BI done right
A single version of the truth. Everyone looks at the same number, calculated the same way, updated automatically. Meetings stop debating whose spreadsheet is right and start discussing what to do.
Autonomy for decision-makers. The manager filters, cross-references, and explores the data without opening a ticket with IT. The question that comes up in the meeting gets answered in the meeting itself.
Management by exception. Instead of reviewing everything, the manager is alerted when something deviates from the norm — falling margin, a client cutting purchases, critical stock levels.
How to make it work (and the pitfalls)
Start with the questions, not the screens. Define the 10 or 15 questions that management needs to answer every week and build the dashboards from them. A pretty dashboard that doesn't answer a business question becomes decoration on a lobby TV.
Fewer indicators, more decisions. Twenty well-chosen KPIs are worth more than two hundred charts. Every indicator on the dashboard should have an owner and an action tied to it.
Take care of data quality at the source. BI exposes whatever the ERP contains — including its errors. Standardized records and disciplined processes in the ERP are a prerequisite, which is why BI and ERP consulting go hand in hand.
Data becomes information. Information becomes results.
The investment in BI usually pays for itself in the first corrected decisions: the product that looked profitable and wasn't, the client that was losing money hidden in freight costs, the stalled stock nobody could see consolidated. The data is already in your company — what's missing is turning it into an answer.